Bending the curve of cost growth has been a expanding issue within health policy discussions – as opposed to the public plan option, which has increasingly been the focus of political health discussions. Recognizing how important cost growth is to health reform, the September/October issue of Health Affairs is dedicated to this topic, and it contains great articles describing various factors causing spending to grow faster than the GDP or general inflation, and some solutions to this ongoing conundrum. However, these articles are like trees in the forest, i.e., they are very important, but a close examination of each one doesn’t provide a broad understanding of the whole forest – or in this case, what bending the curve of healthcare cost growth might look like.
Below are summaries of five of the Health Affairs articles – all are worth a close read. And following that are some illustrations of what bending the curve could look like based upon current projections for healthcare costs, GDP, and inflation.
Trees Within the Forest – High Cost Growth Causes and Cures
Five very interesting articles that describe various aspects of the causes of and cures for health spending growth from the current issue of Health Affairs are:
- Henry Aaron’s and Paul Ginsburg’s “Is Health Spending Excessive? If So, What Can We Do About It?” is a clear, concise and extremely useful article that would be a great read for students and policy-makers. Their article has two excellent tables. The first covers common questions (and answers) about health spending. And the second describes the factors contributing to the growth in health spending, (arranged in into the groups of: Demand, Supply, Institutions, and Research), and notes whether policy changes to specific factors within these groups “can or should” reduce the growth in health care spending.
- Arnold Milstein’s and Elizabeth Gilbertson’s “American Medical Home Runs” describes 4 primary care organizations that have successfully reduced costs without reducing quality. Examining these sites, they found the leaders driving changes had 4 elements in common: persistence, tolerance for risk, instinct for leverage on clinical and economic outcomes, and personal accountability. (For those who have studied healthcare system and culture change, these elements shouldn’t be too surprising.)
- John Toussaint’s “Writing the New Playbook for U.S. Health Care: Lessons from Wisconsin” describes the ThedaCare hospital system’s application of the Institute of Healthcare Improvement’s “lean manufacturing” principles, and how it led to dramatic reductions in waste and quality improvement – primarily by using team-based care to eliminate unnecessary steps in care delivery. His article notes that physician culture change was required for this transformation, and that their costs savings benefited payers – including Medicare – but the existing reimbursements system penalizes them for this, since it really creates incentives for waste by paying provider organizations more if they have higher care delivery costs due to wasteful actions.
- Martha Bebinger’s “Mission Not Yet Accomplished? Massachusetts Contemplates Major Moves on Cost Containment” is a good description of the global payment proposal the state is considering. She also describes one Massachusetts health delivery system’s success, (Mt. Auburn hospital and its IPA), in working with global payment type reimbursements for about 20 years.
- Harold Miller’s “From Volume to Value: Better Ways to Pay for Health Care” is a great companion to Martha Bebinger’s article because it provides a conceptual description for what Massachusetts’ global payment proposal is attempting to achieve, i.e. moving away from fee-for-service’s volume incentives to a payment system that rewards quality of care within an environment of fiscal responsibility. His Exhibit 1 illustrates how insurance risk can be separated from provider or performance risk – one of the concepts incorporated into Massachusetts’ global payment proposal. And his Exhibit 3 describes why there may be a role for continuing fee-for-service payment for certain types of low-cost, low-variability, high-social value services such as immunizations. (Overall the mechanisms for implementing global payments reminded me of a book chapter I co-authored in 1995 about bonus pools and incentive payments for physicians, “Preparing for Managed Care and Capitation,” in Alliances: Strategies for Building Integrated Delivery Systems. What has changed in the last 15 years is that quality monitoring capabilities have matured so that relevant data can be captured and analyzed quickly enough to serve as a reasonable basis for making such bonus and incentive payments.)
Forest of Trees – What Bent Cost Curves Might Look Like
While these 5 articles – and the entire issue of Health Affairs – offer great insights into health spending growth in the US, they don’t provide a broad context for what health spending growth and bending the cost curve might look like. Similarly, while the research and insights provided in the Health Affairs articles are important for health policy decision making, they may not be easily usable within the big-picture policy and political debate. In other words, these articles are describing specific trees within the healthcare cost growth forest, and what most people need is a better understanding of the entire forest.
Henry Aaron’s and Paul Ginsburg’s article comes closest to painting this overarching view of the cost growth situation and its solutions, but I was somewhat surprised that nowhere in the issue is there a simple graphic showing projected healthcare cost growth and some scenarios for literally “bending the curve.” Therefore, below are somewhat simple graphs depicting expected future spending growth and various scenarios for bending the curve of healthcare costs.
First, is a figure showing 8 different cost growth curves with the y-axis showing years
(Descriptions of each curve are below the figure)
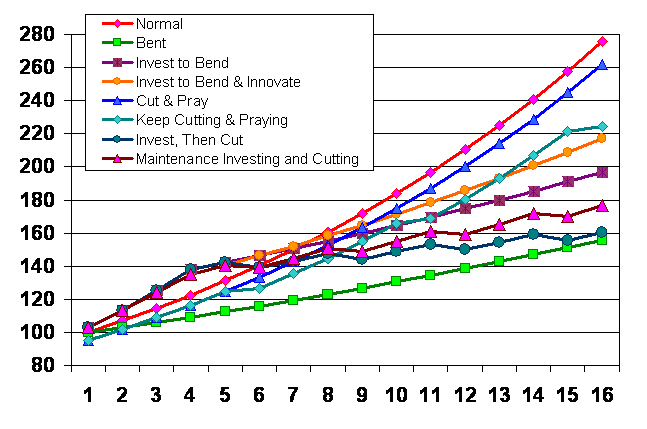
- Normal
- 7% Growth Rate (7% was chosen as a flat rate based upon the National Health Expenditure projections, which vary from about 5-7% in the coming years, but are 7.2% for years 2017 and 2018.)
- Bent
- 3% Growth Rate (3% was chosen as a flat rate for what might ideally be desired based upon projections for CPI-W of 2.8% and GDP growth of 4.6-4.9% for years 2011-18.)
- Invest to Bend
- 7% Growth Rate until year 4, then 3%/year
- 3% Investment Added in Years 1-4 (These investments would be expected to enable the healthcare system to operate at a 3% growth rate in later years.)
- Invest to Bend & Innovate
- 7% Growth Rate until year 4, then, 3%/year
- 3% Added Years 1-2, 2% in Years 3-4, and 1% added from year 5 onward (This curve is like #3, but the investment amount is reduced to 2% in years 3-4 and then continues at 1% in all subsequent years.)
- Cut & Pray
- 7% growth rate
- 5% cut first year (One-year cut that doesn’t change long term growth.)
- Keep Cutting & Praying
- 7% growth rate
- 5% cut 1st year and every 5th year (This is a variant of #5 in that expenditures are cut 5% every 5 years to reduce spending.)
- Invest, Then Cut
- 7% Growth Rate until year 4, then 3%/year
- 3% additional investment in years 1-4
- 5% cut in years 6, 9, 12, 15, etc.
(This is a combination of curves #3 and #6, but the 5% reductions are every 3 years rather than every 5 years.)
- Maintenance Investing and Cutting
- 7% Growth Rate until year 4, then 3%/year
- 3% additional investment in years 1 & 2
- 2% additional investment in years 3 & 4
- 1% additional investment each year after year 4
- 5% cut in years 6, 9, 12, 15, etc.
(This is a combination of curves #4 and #6, with a early year investments in system change leading to a 3% baseline growth rate – with an additional 1% added for innovation investment – and 5% cuts every 3 years to reduce waste.)
View of the Forest Depends on the Altitude
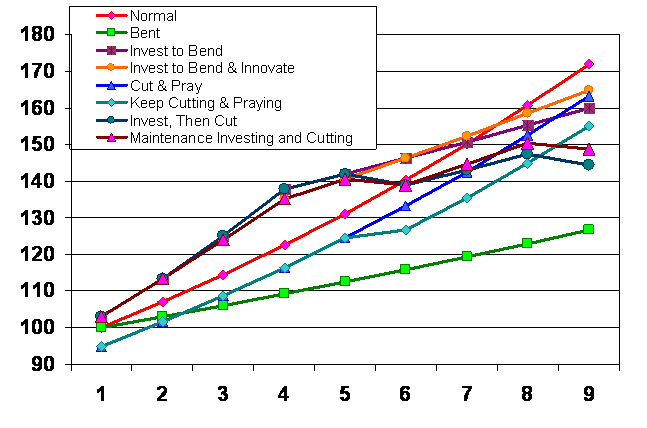
Time-frames are an important consideration for evaluating each possible curve. For example, looking only at the first 9 years doesn’t show much difference from the 7% baseline growth rate for the various scenarios, except for immediately going to a 3% growth rate. (See figure below)
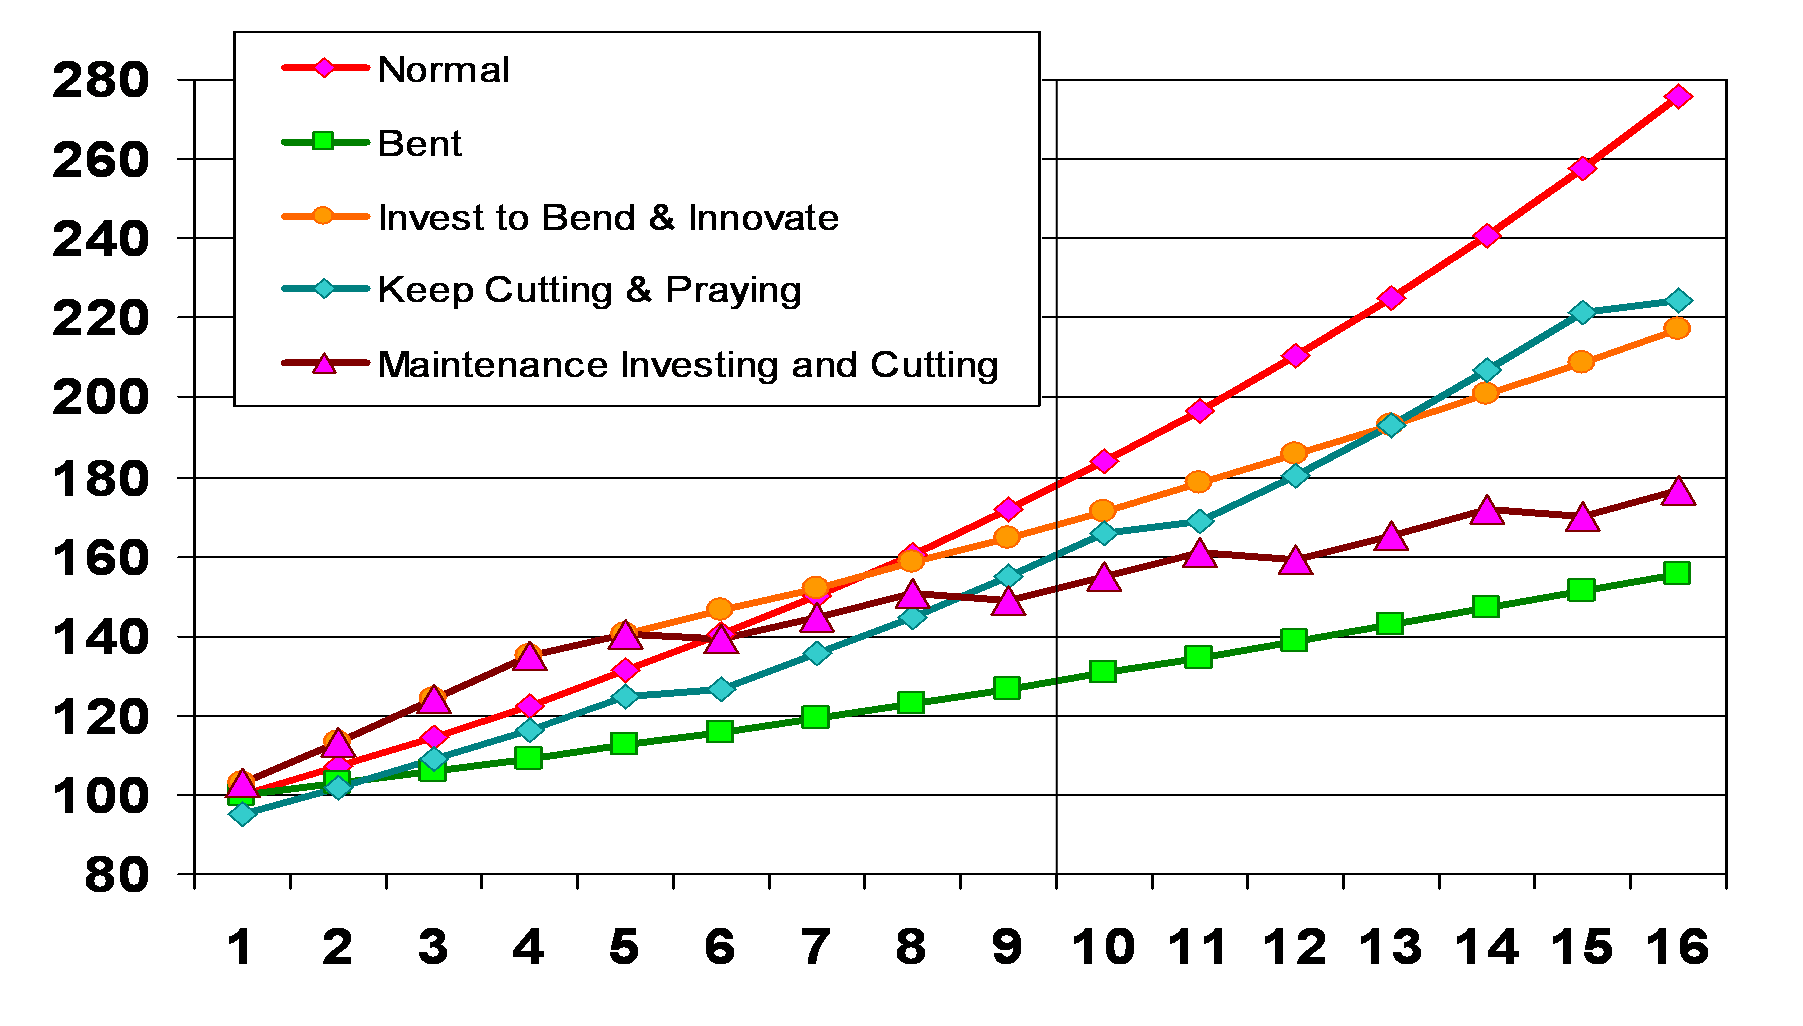
However, removing some of the options and expanding the time-frame back to 16 years, shows that three options, (between the projected 7% baseline growth rate and the unrealistic immediate shift to 3%), can achieve dramatic savings. In particular, investing in early years to create a system that can both control cost growth and eliminate waste in the long-run, (Maintenance Investing and Cutting curve scenario), brings us to a cost growth rate that approaches what might have been achieved by immediately going to a 3% growth rate. (See figure below)
Of course, the actual dollars spent is a factor of the area under the curve, so the “Maintenance Investing and Cutting” curve does represent more spending on healthcare than some other scenarios – depending upon the time-frame analyzed. However, up-front investing in health system change has already happened. The Federal stimulus bill passed earlier this year included more than $30 Billion in healthcare system changing investments, which is more than 1% of total annual healthcare spending.*
Actually Bending the Cost Curve Requires Organizational and Culture Changes
The policy and practical challenges for bending the cost curve are choosing and implementing the options that will actually change clinical and reimbursement systems that can get us to the bent curve we want. In addition, convincing the public and millions of people employed in healthcare that these changes are productive and beneficial will also be a great challenge. And meeting this challenge will require changing organizational cultures and operations, and individual attitudes and actions. Hopefully, graphs like this will help make the case that bending the curve is possible, practical, and palatable.
————–
* The American Recovery and Reinvestment Act of 2009 included $10 billion in increased funding for the NIH, $19 Billion for health information technology, $1.1 Billion for comparative effectiveness research, $500 million to train primary care clinicians, and $1 billion for several prevention and wellness programs – as well as $86 billion for expansion of Medicaid.

[…] elsewhere on Eph Planet, Michael Miller ‘82, who writes a wonky health care policy blog, provides a detailed analysis of what bending the cost curve in health care would require. Tags: healthcare, swine fluComment […]