I was at a party over the weekend with a number of clinical Fellows from a major academic medical center. They were all very nice, but I had a very strange conversation with a couple of the Fellows.
The conversation became strange when one of them asked me about what I thought was the biggest healthcare spending problem. Rather than let me fully explain what I thought, they somehow quickly pronounced that pharmaceuticals were the largest cost in the US healthcare system, implying that this was the biggest spending problem. The strange part of this conversation was that one of them had just taken a health policy class at the public health school affiliated with their Fellowship program.
After “discussing” this with them for what seemed like 20 minutes, (but it was probably actually only 10 minutes), I convinced them that the reality was that hospitals and clinical services each represented about 30% of healthcare spending, and that pharmaceuticals were only about 10-11%. (That 10-11% is only outpatient prescription drugs, but inpatient medicines don’t represent a major cost for hospitalizations. And besides, payers don’t pay for inpatient pharmaceuticals as a separate cost, they pay hospitals a global fee based upon the patient’s diagnosis and severity of illness.)
Anyhow, after this conversation, the party’s host (who had been listening to our conversation from afar) came up and asked me if they were wrong – and I confirmed to him that they were – which is what he suspected. (He’s a very smart computer scientist guy!)
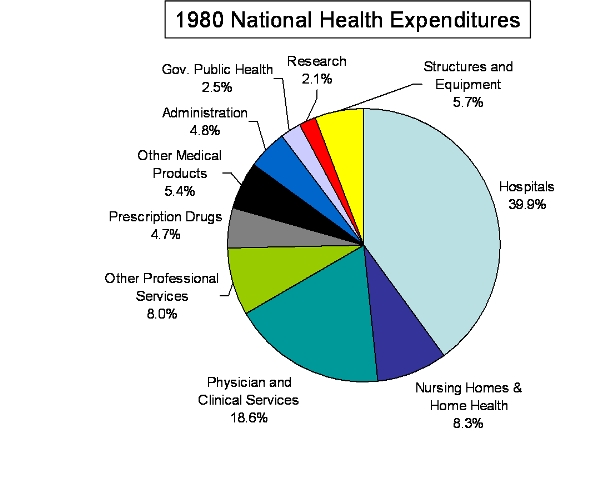
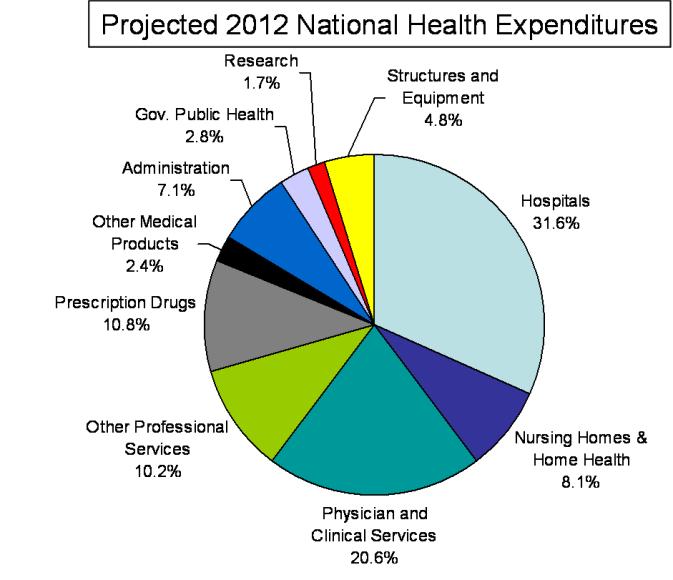
So, after the party I decided to look up the actual numbers – since I can’t keep them exactly correct in my head – and according to the National Health Expenditure Data collected by the Center for Medicare and Medicaid Services, the following pie charts display various categories for where health spending in the US went in 2006 (the latest year data is available), 1980, and the projections for 2012:
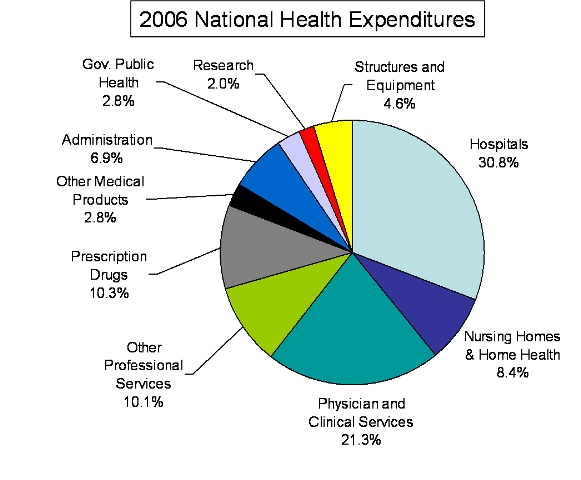
[Note – In my conversation with the two clinical Fellows, my memory wasn’t far off. In 2006 spending was: Hospitals = 30.8%, All Professional Services = 31.4%, and Prescription Drugs = 10.3%]
While this data is illuminating, I’m still bothered by these two young physicians insisting that prescription drugs are the biggest piece of health spending in the US – especially since one of them had just finished a 2.5 credit class called “Current Issues in Health Policy.” And if these medical professionals have that magnitude of misunderstanding about our healthcare system’s finances, it’s no wonder that the average American, legislator, or media professional, is confused. But at least it seems the computer scientists know what’s going on.

[…] Last summer I wrote about the the trends in this health spending and the confusion some physicians have about the…. This post might also be of […]
[…] how health care costs are growing or what really is contributing to this growth. I believe my graphically enhanced presentation on this from August is a much clearer and accurate presentation. In particular, their assertion that prescription […]
The “Nursing Homes and Home Health” component of national health spending has remained fairly consistent, around 8%, since 1980 and projected through 2012. Shouldn’t the aging population and consequent changes in patient demographics have resulted in an increase in utilization for these services? What effects can we expect the aging population to have on health care in a general way, and more specifically, shouldn’t it be represented (to some extent) in a re-balancing of the expenditures by service breakdown?